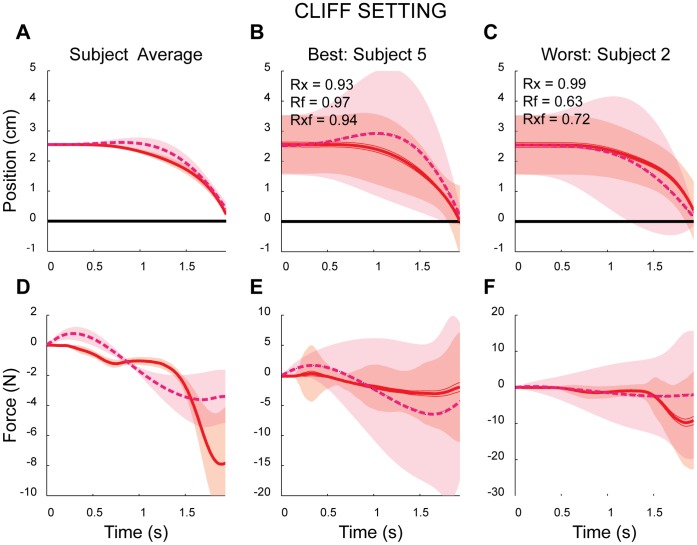
Figure 3. Example subjects and model data in the CLIFF block (velocity profiles not shown).

A), D) Across-subject/model average trajectories for position and force, respectively. B), E) The subject and model with the best fit. C), F) The subject and model with the poorest fit. In all panels solid and dashed lines indicate subject and model mean trajectories, respectively. Shaded regions represent either +/− SEM (panels A and D) or +/− standard deviation across trajectories (remaining panels).
