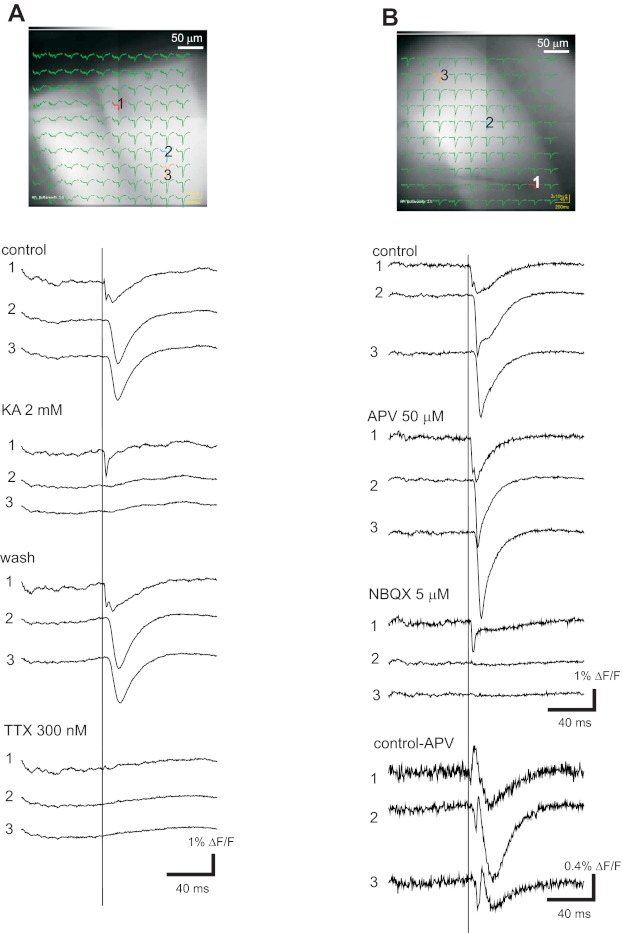
Fig. 5.

Glutamate receptor and Na+ channel dependence of hVOS 2.0 signals. Images of the CA1 region with traces superimposed are shown for 2 experiments, with traces from the indicated locations below the images. A: control traces show responses before drug addition; 2 mM kynurenic acid (KA) blocked responses except in traces close to the stimulation site. Washing out drug reversed the block. TTX (300 nM) blocked responses including those close to the stimulation site. B: control traces show responses before drug addition; 50 μM APV blocked N-methyl-d-aspartate (NMDA) receptors, revealing the dl-α-amino-3-hydroxy-5-methylisoxazole-propionic acid (AMPA) receptor-dependent component; subsequent addition of 5 μM NBQX (with continued presence of APV) blocked the AMPA receptor-mediated responses, leaving only a local spike near the site of stimulation. Scale bars near NBQX traces apply to control and APV. The bottom 3 traces are differences formed by subtraction of the traces in APV from control traces to show the NMDA receptor-mediated component. These traces are displayed with an expanded scale. All responses were evoked by 0.18-ms, 200-μA pulses at location 1. [DPA] = 4 μM; all traces were averages of 10 trials.
