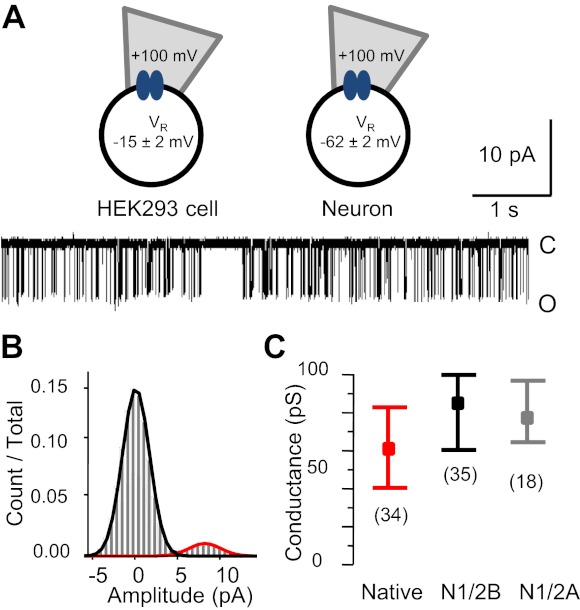
Fig. 1.

N-methyl-d-aspartate receptor (NR) unitary conductance. A: cell-attached patch-clamp recording configuration used in this study (top) and representative single channel current trace recorded from a native receptor [29 days in vitro (DIV); bottom]. HEK-293 cell, human embryonic kidney-293 cell; VR, recorded voltage. B: event amplitude histogram for the entire record illustrated in A (21,507 events, 14 min) overlaid with the probability density function calculated for a two-state model. Values are means ± SD. Components are in black [closed (C), 0.01 ± 1.56 pA] and red [open (O), 8.9 ± 1.9 pA]. C: summary of unitary conductance results showing the means (boxes) and ranges (whiskers) for the three conditions indicated.
