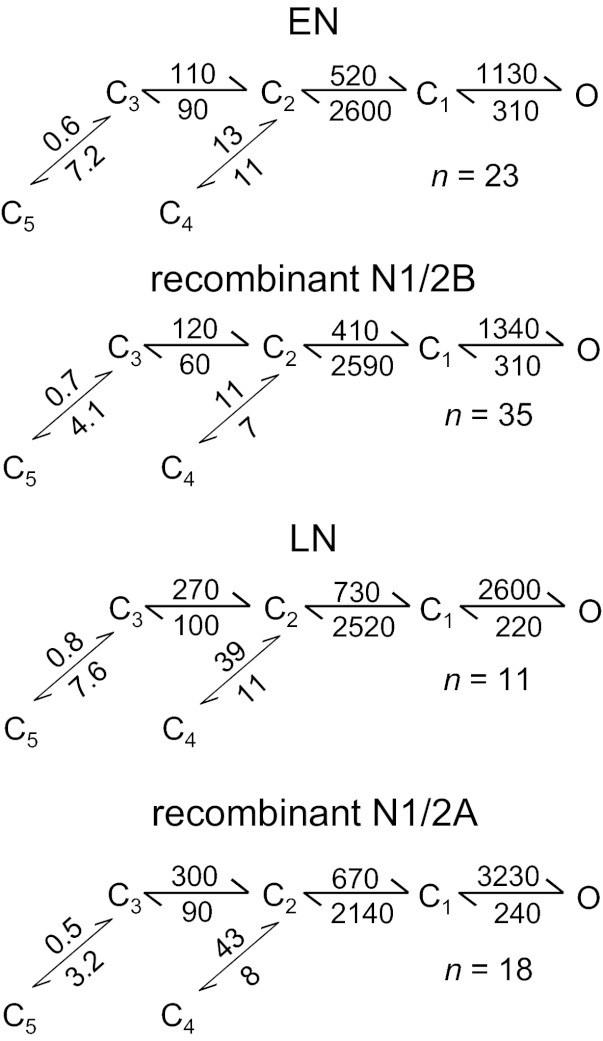
Fig. 3.

NR gating mechanisms. Rates (in s−1) are given for each transition as the rounded average across all records in each set. Differences were not significant between EN and N1/2B receptors or between LN and N1/2A receptors for any of the transitions estimated (P > 0.05 by Student's t-test).
