
Fig. 6.
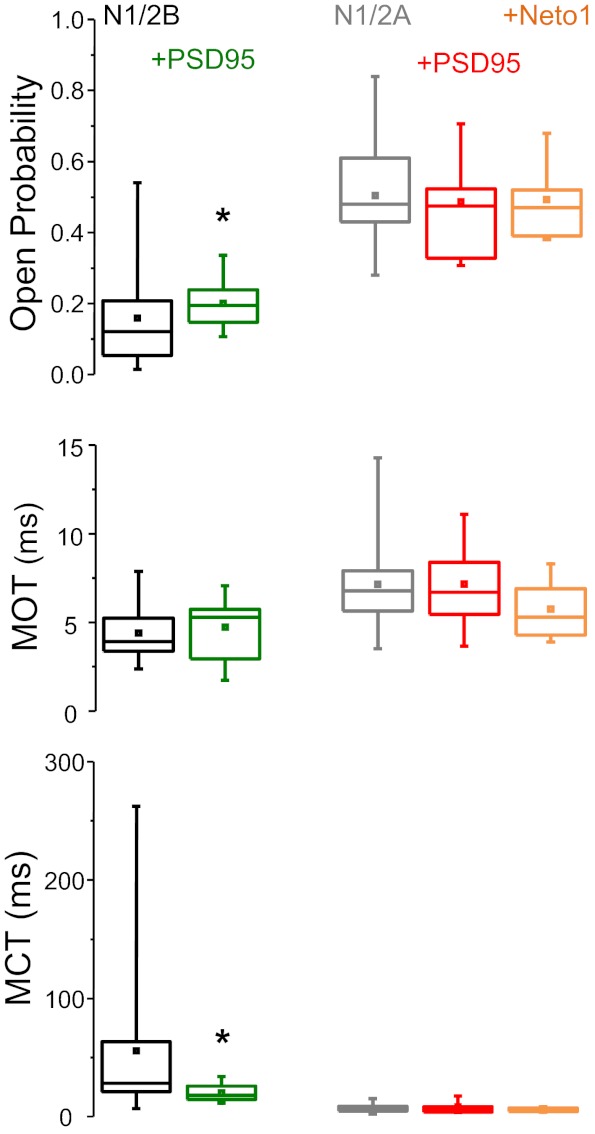
Effects of PSD95 and Neto1 on recombinant NR single channel kinetic parameters. Statistical graphs show the means (box), medians (line), and ranges (whiskers) of values measured for N1/2B (black), N1/2B + PSD95 (green), N1/2A (gray), N1/2A + PSD95 (red), and N1/2A + Neto1 (orange). MCT, mean closed time. *Significant differences in the variance of these parameters observed in cells transfected with NR subunits alone relative to those observed in cells cotransfected with PSD95 (P < 0.05 by F-test).