Fig. 6.

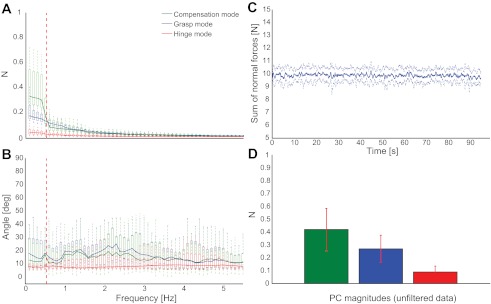
A: measured magnitudes of the 3 principal components (PCs) vs. frequency in the original object manipulation task. Not surprisingly, near the task-relevant frequency of 0.5 Hz (vertical red dashed line), the Compensation Mode dominates the overall force variability, as suggested by simulation 1. However, at those frequencies, subjects exhibit considerable contributions to force variability from the Grasp Mode. Box plots indicate the distribution of these variability contributions across the 7 subjects. B: difference in angle between the directions of the measured and the analytical PCs. Box plots reflect the fact that the 3 normal force correlation modes did not vary much across subjects and were closely aligned with the theoretical correlation modes. Differences across subjects and between observed and theoretical modes mostly indicate the variability of object orientation during task performance. C: average sum of normal forces across the 7 subjects in the original object manipulation task. Subjects were well able to meet the 10 N target. D: 3 force mode magnitudes computed from the unfiltered data (square root of the eigenvalues), showing that, overall, the Compensation Mode contributes most of the force variability and the Hinge Mode contributes the least, reflecting successful task performance. (Note that the values are in Newtons and do not represent proportions of variance. No statistical tests are done on these data because they simply show the total variance across all frequencies.)
