Fig. 1.

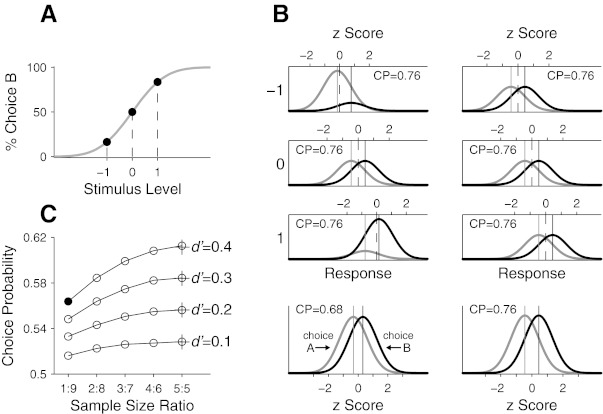
Potential confound in estimation of choice probability (CP) caused by pooling z-scored neuronal responses across different stimulus conditions. A: a hypothetical psychometric function relating the proportion of 1 of 2 choice behaviors in a 2-alternative forced choice (2AFC) task as a function of stimulus level. The two choices are denoted A and B, and a positive stimulus contains signal that evokes the perceptual state mapped onto choice B. The ratios of choice A against choice B at the 3 stimulus levels (−1, 0, 1) are 5:1, 1:1, and 1:5, respectively. B: distributions of the response of a hypothetical neuron to the stimulus at the 3 different levels in A. Distributions of the response preceding the 2 behavioral choices are plotted separately: gray distributions are for choice A and black distributions for choice B, with their means marked by lines of corresponding colors. Distributions on left are in accordance with the ratios of the 2 behavioral choices following the psychometric function in A, and those on right have an equal number of trials for the 2 choices. Top horizontal axis at each stimulus level represents the neuronal response in z score, with its mean marked by a dashed line. Bottom: distributions of the z-scored responses combined across the 3 stimulus levels shown above. C: simulated CPs as a function of sample size ratio for different underlying population CPs indicated by crosses.
