Fig. 2.

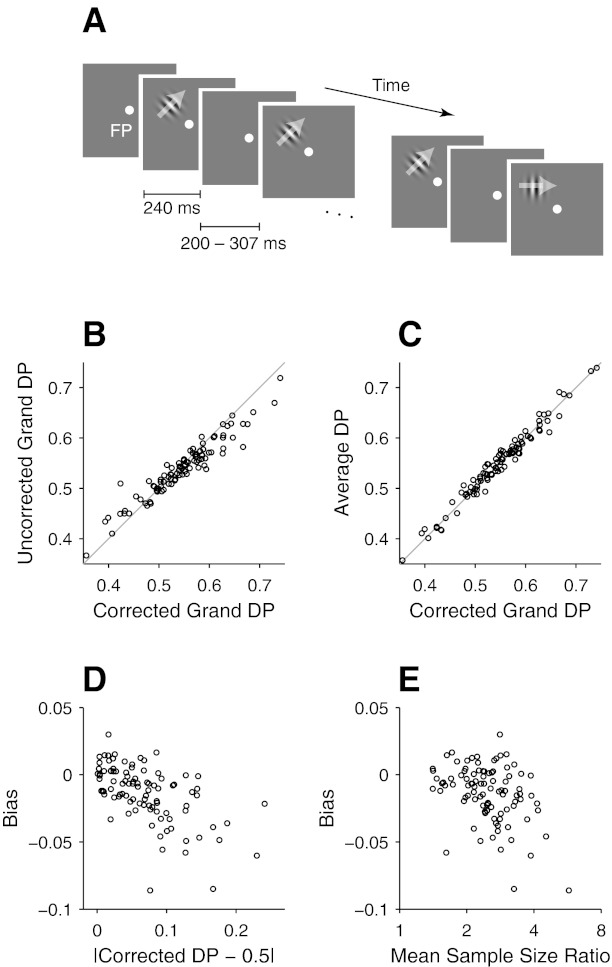
Effects of z-score-based pooling of neuronal responses on detect probability (DP) measures in neurophysiological data. A: schematic representation of the stimulus sequence in a trial of the behavioral task used to collect neuronal data shown in B–E and also in Figs. 6 and 7. See materials and methods for details. FP, fixation point. B: scatterplot between corrected and uncorrected grand DPs of 96 V1 neurons from 2 monkeys. The uncorrected grand DPs (y-axis) were calculated from neuronal responses combined across different target directions with conventional z scores, and the corrected grand DPs (x-axis) were estimated with balanced z-scoring. Gray line is the unity line. C: scatterplot between corrected grand DPs and DPs estimated as the means of DPs calculated with spike counts within individual stimulus conditions (average DP: y-axis). D: scatterplot between the bias of uncorrected grand DPs (y-axis) and the deviation of the corrected grand DPs from 0.5 (x-axis). E: scatterplot between the bias and the mean sample size ratio. See text for the calculation of the mean sample size ratio.
