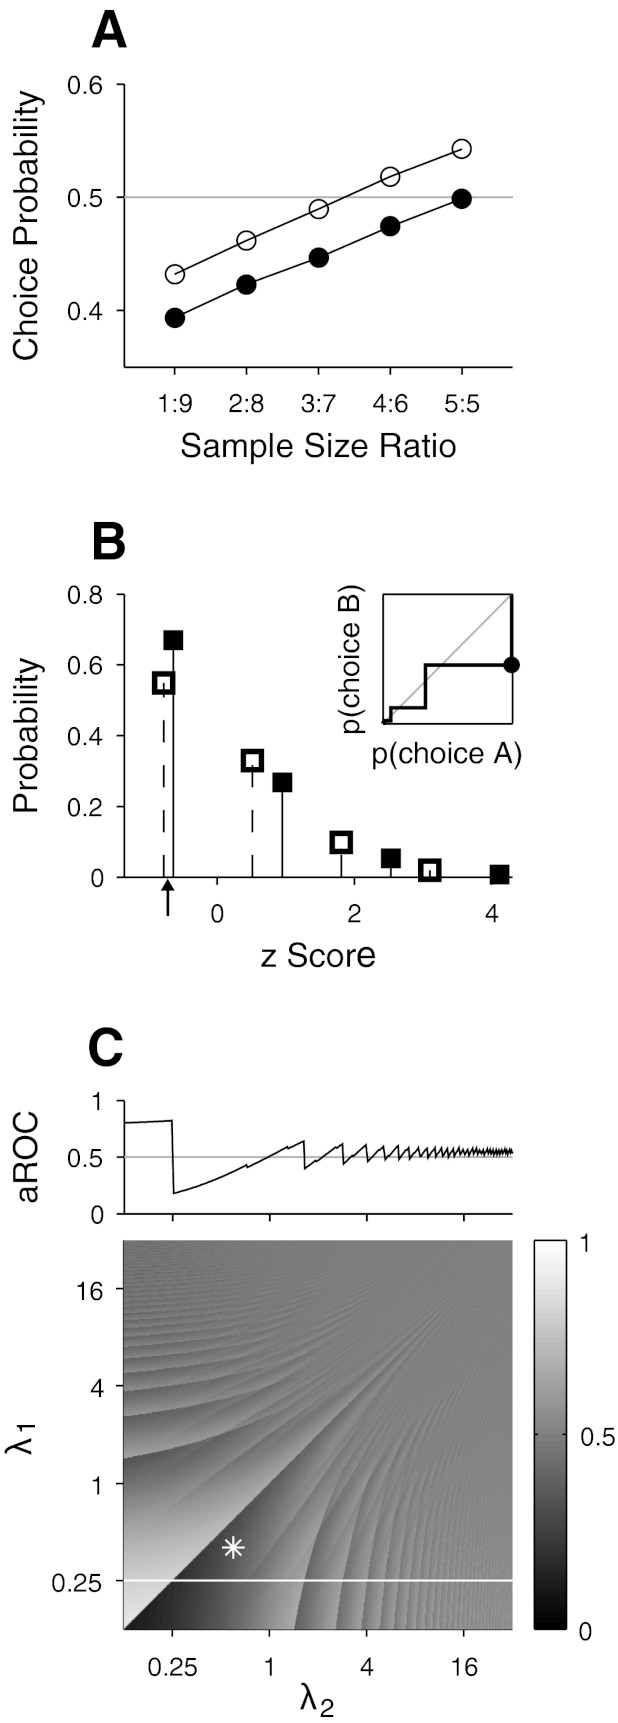
Fig. 3.

Artifact of combining z-scored neuronal responses across stimulus conditions for a neuron with a low firing rate. A: CPs estimated from simulated responses of a Poisson-spiking neuron firing few spikes. Neuronal responses were combined across 2 stimulus conditions, and the ratio of sample sizes for the 2 behavioral choices was varied (x-axis). Open circles plot the mean CPs simulated under the assumption that the neuronal response was positively correlated with behavior in both stimulus conditions, and filled circles represent the same measurements but under the assumption of no correlation. B: Poisson probability mass functions plotted on a z score axis. Filled squares represent probability masses of a Poisson variable with a mean of 0.4 for events from 0 to 3, and open squares represent the corresponding values for a mean of 0.6. Solid line in inset displays the receiver-operating characteristic (ROC) curve constructed from these probability mass functions assuming that they represent the response distributions for the 2 behavioral choices: the probability mass function with a mean of 0.4 for choice A and the other for choice B. Filled circle in the ROC curve is the point at which the response criterion in the ROC analysis is located between the z scores corresponding to 0 spike count in the 2 distributions (arrow). C: area under the ROC curve (aROC) calculated from pairs of Poisson probability mass functions for different combinations of means (λ1 and λ2). Bottom: aROC in gray scale (scale bar on right). Asterisk corresponds to the area under the ROC curve shown in inset of B. Top: aROC when λ1 was fixed at 0.25 (i.e., cross section of white line, bottom).
