Fig. 6.

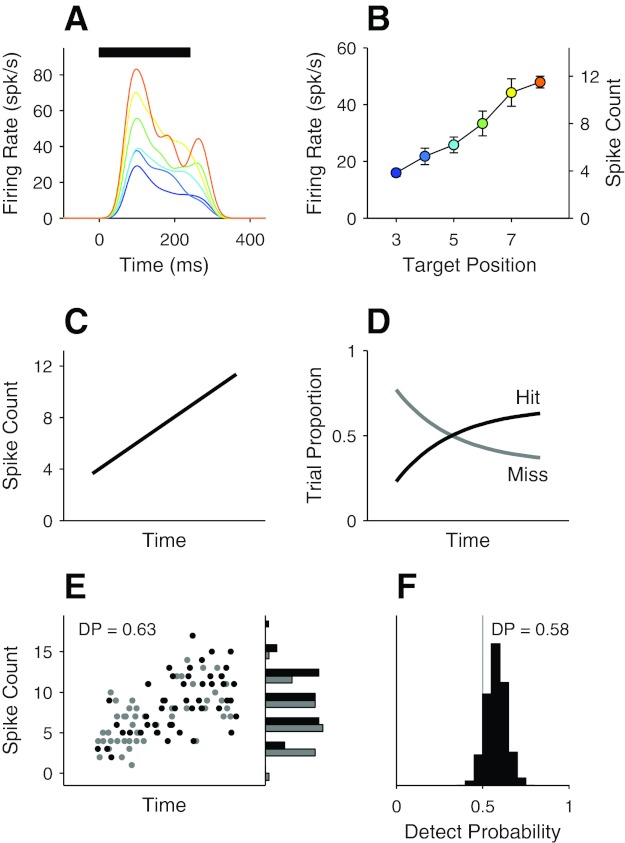
Artifactual DP resulting from concurrent modulations of the neuronal response and the behavioral performance over time within a trial. A: response of 1 of the neurons shown in Fig. 2 to a target stimulus (a 4.2° change from the direction of the reference stimulus). Average responses of the neuron to the target stimulus appearing at different positions in the stimulus sequence within a trial are shown in different colors. Spike trains were convolved with a Gaussian kernel (SD = 20 ms). Horizontal bar indicates time of stimulus presentation. B: mean responses of the neuron in A as a function of target position in the stimulus sequence within a trial. The responses are mean firing rates (or mean spike counts on right y-axis) during a 240-ms interval beginning at 30 ms from the target onset. Colors coding the target position are the same in A and B. Note that the earliest target occurrence in the task was on the 3rd stimulus flash (see materials and methods). Error bars indicate SE. C–F: simulation. C: response profile of hypothetical neuron used in the simulation. The response was modeled after that of the neuron in B. D: hypothetical performance of the subject that was obtained simultaneously with the response of the neuron in C. E: simulated neuronal responses from an iteration of the simulation. Neuronal responses (in spike count) on hit (black circles) and miss (gray circles) trials are plotted on left as a function of the position of the measurement interval within a trial, which was determined by the subject's reaction time, and their marginal distributions on right. See text for details of the simulation procedure. F: distributions of simulated DPs calculated from 2,000 iterations.
