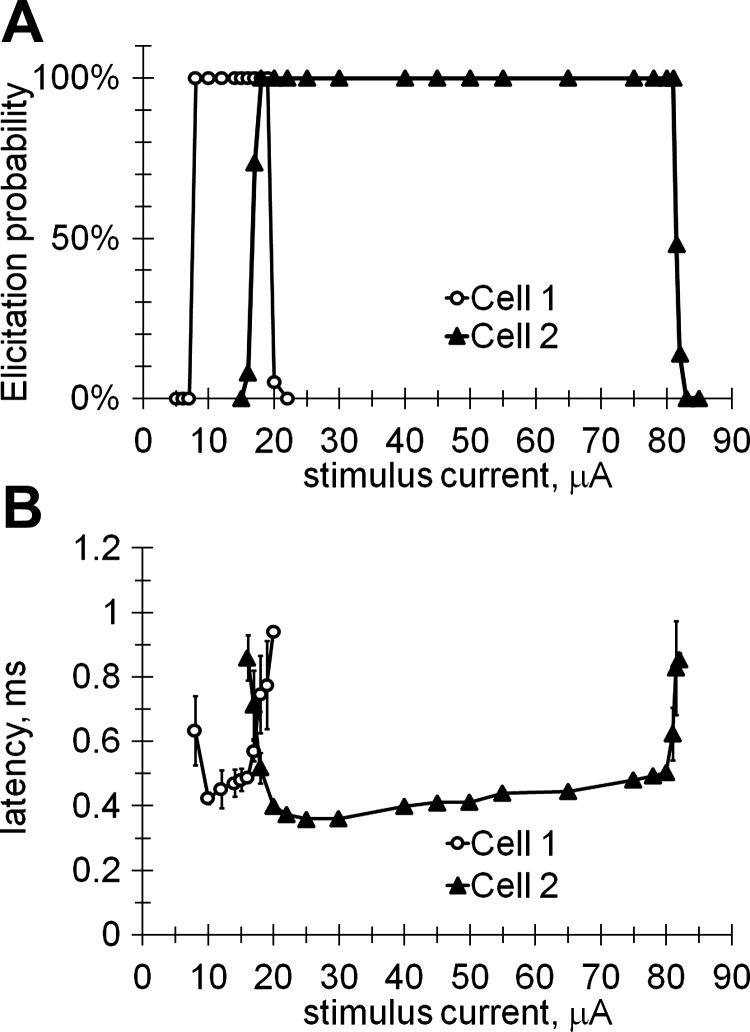
Fig. 3.

Spiking elicited by 0.1-ms cathodic pulses as a function of the stimulus current shown for 2 different RGCs located at different distances from the stimulating electrode. A: probability of eliciting the APs. B: latency of elicited AP. Error bars correspond to the standard deviation of successive recordings. The number of independent data points shown for cell 1 is 14 and for cell 2 is 21.
