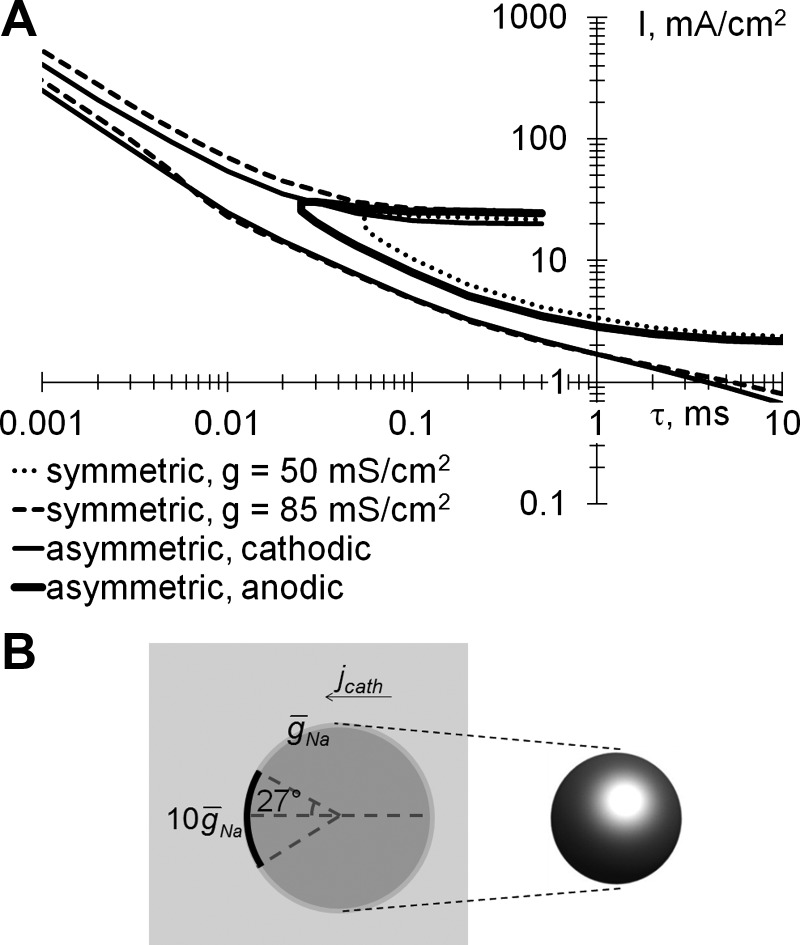
Fig. 5.

A: modeled strength-duration dependences of the upper and lower thresholds of stimulation for rectangular monophasic pulses. Curves are shown for symmetric soma with a sodium ion channel conductivity (ḡNa) of 50 mS/cm2 (dotted line)or 85 mS/cm2 (dashed line) and asymmetric soma stimulated with cathodic (solid thin line) and anodic pulses (solid thick line) applied via epiretinal electrode. B: model of an asymmetric soma stimulated with a cathodic pulse (jcath).
