
Fig. 4.
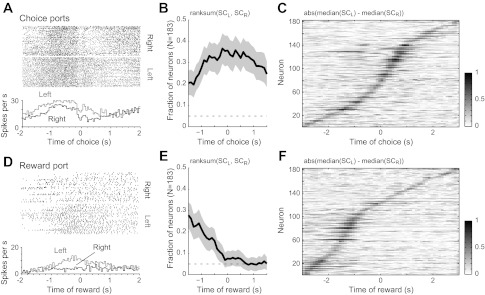
Neurons encoded the choice made at the end of the delay period. A: example of a neuron that fired more when the rat entered the left choice port compared with the right port. Spike rasters are shown at top, and the average firing rates (0.1-s bins) on trials with left and right choice are shown at bottom. The neuron fired at a tonically elevated rate throughout the choice epoch, starting from the end of the delay period. B: fraction of neurons that was sensitive to the spatial location of the choice when rats entered the choice ports. The fraction of cells with P < 0.05 (with Bonferroni correction, P < 0.0125) from a rank sum test of spike counts(SC) in a sliding 1-s window (steps of 0.1 s) is depicted by the black line. The 95% confidence interval is shown as gray shading. C: normalized difference in spike counts around the time of choice port entry for all neurons (1 per row) recorded in the 5 rats. None of the neurons fired at distinct rates throughout the period of the choice. Each pixel represents the difference in spike counts in a 0.1-s bin and was calculated as abs[median(SCL) − median(SCR)]. Differences in spike counts are sorted by the time of maximum difference in spike counts on left and right trials. D: example of a neuron that fired more when the rat entered the reward port after responding in the left choice port. E: fraction of neurons that was sensitive to the spatial location of the preceding choice when rats entered the reward port. F: normalized difference in spike counts based on the location of the preceding choice during the period of travel to the reward port and the initial period of reward consumption. As in C, none of the neurons fired at distinct rates throughout the period of reward consumption based on the preceding choice.