
Fig. 7.
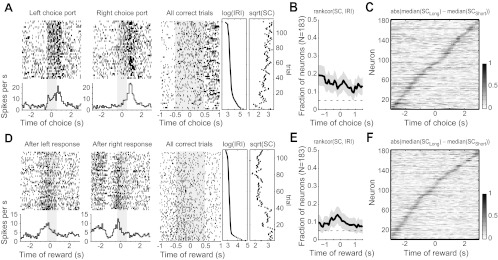
Neurons encoded the time since the last choice was made (i.e., pace). A: a neuron is shown that fired more during left responses compared with right responses (left). Raster on right shows the spike data collapsed over response ports and sorted by the IRI. A clear effect of the time since the last choice was made (“pace”) is revealed in this plot (Spearman's rank-correlation, P < 0.0125). The 2 plots on right show the IRI associated with each row in the raster plot and the spike count (SC) from the neuron during the ±0.5-s epoch around port entry. B: fraction of neurons that was sensitive to the time since the last choice was made when rats entered the choice ports. C: normalized difference in spike counts around choice port entry for trials in the upper and lower halves of the IRI distribution [i.e., Long = IRI > median(IRI)]. D: spike activity from a neuron that showed pace-related activity at the reward port. E and F: same plots as B and C for the period of reward port entry and fluid consumption.