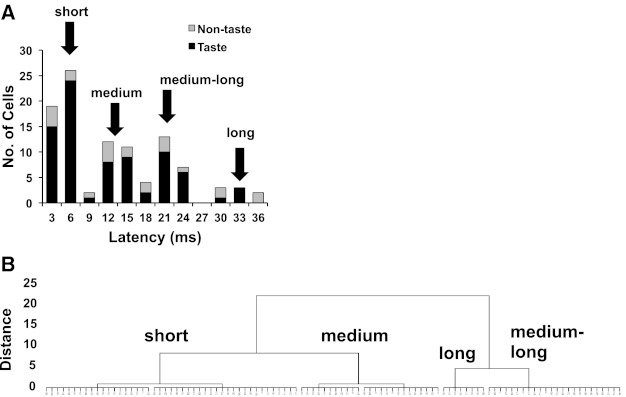
Fig. 1.

A: frequency distribution of the latency of evoked response to electrical stimulation of the chorda tympani (CT) nerve across 102 nucleus of the solitary tract (NTS) cells. Black bars indicate taste-responsive cells; gray bars indicate non-taste-responsive cells. Values along the x-axis indicate the upper limit of each bin. Arrows above the graph indicate latency groups. B: dendrogram showing results of a hierarchical cluster analysis conducted on latency and jitter for each cell. See text for details.
