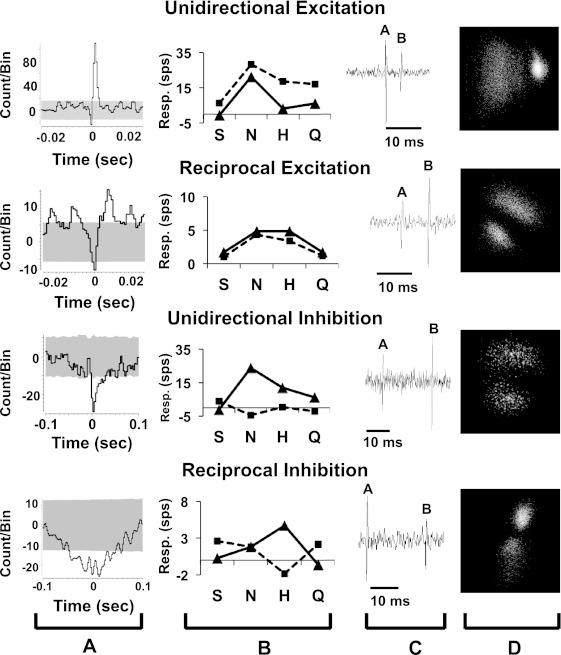
Fig. 5.

Cross-correlograms and taste response profiles of cells with different types of functional connectivity. A: cross-correlation functions (CCFs) for each cell; shaded area indicates 99% confidence limit. B: taste response magnitudes for the source cell (solid line) and target cell (dashed line). C: raw electrophysiological records of each cell; A is the source and B is the target cell. D: results of principal component analyses of waveforms of cells shown in C.
