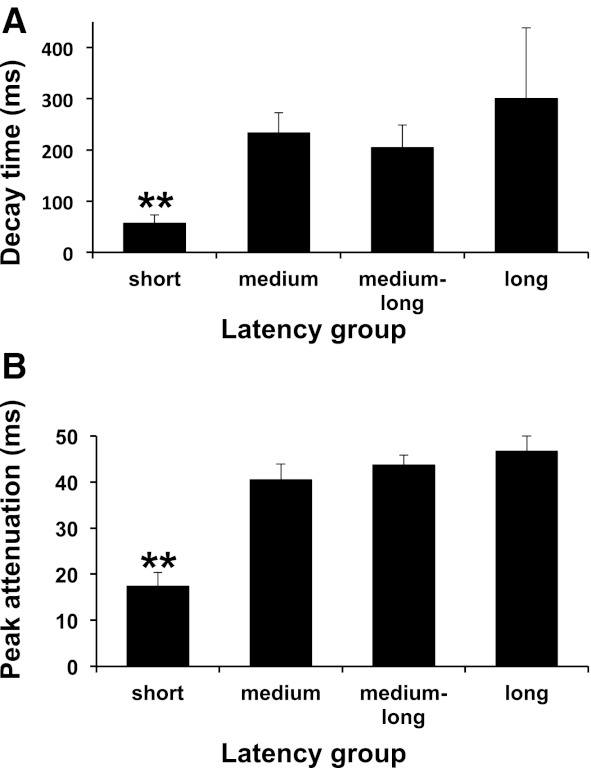
Fig. 7.

A: mean + SE decay time in each latency group for cells that showed paired-pulse attenuation. B: mean + SE peak attenuation time in each latency group for cells that showed paired-pulse attenuation. Cells in the short-latency group that showed paired-pulse attenuation had significantly shorter decay time constants and peak attenuation times compared with cells in the medium-, medium-long-, and long-latency groups. **Short-latency groups are significantly different from all other groups with P < 0.01.
