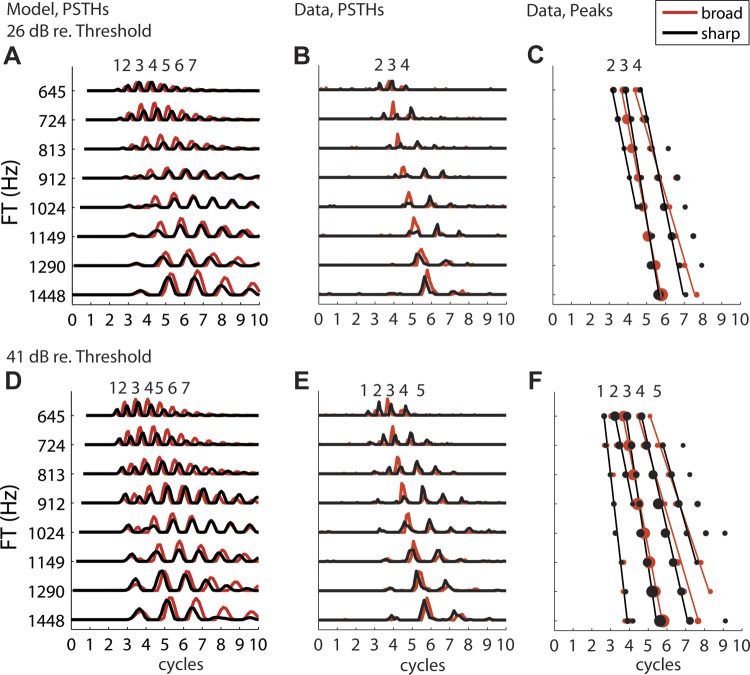
Fig. 2.

Response patterns of real and model AN fibers with CF 972 Hz to Huffman stimuli with varying FT on the y-axis and time in cycles of FT on the x-axis: responses to stimulus with broad phase transition in red and sharp phase transition in black. A: model fiber response poststimulus time histograms (PSTHs) at 26 dB re. CF tone threshold (41 dB SPL). B: real fiber response PSTHs at 26 dB re. CF threshold (61 dB SPL). C: peak locations and fitted lines for AN fiber response in B. D–F: same as A–C at 41 dB re. CF threshold (56 dB SPL for model fiber, 76 dB SPL for real fiber).
