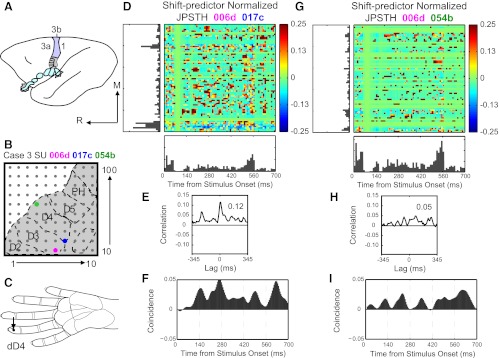
Fig. 1.

Examples of normalized joint peristimulus time histograms (JPSTH) reveal reliable correlations in spike timing between neuron pairs. A: schematic of owl monkey brain shown with area 3b highlighted in color and hand representation shaded gray. M, medial; R, rostral. B: estimated location of 100-electrode array for case 3 shown with representations of digits (D2–D5) and palm including the hypothenar (PH) pads outlined. Colored dots mark electrodes where single units 006d (pink), 017c (blue), and 054b (green) were recorded. C: arrow points to stimulation location (distal D4, dD4) on hand schematic for results in D–I. D: strong spike timing correlations between 006d and 017c revealed in normalized JPSTH. Color code represents magnitude of normalized correlation. E: correlation histogram derived from normalized JPSTH shows spike times correlated with peak magnitude of 0.12 (shift-predictor correction already applied). F: coincidence histogram shows dynamics of the normalized correlation over the stimulus presentation time. G: weaker spike timing synchrony revealed in normalized JPSTH and correlation histogram (H) between 006d and 054b, which are farther apart in cortex than 006d and 017c. I: coincidence histogram rises variably throughout stimulus duration.
