Fig. 3.

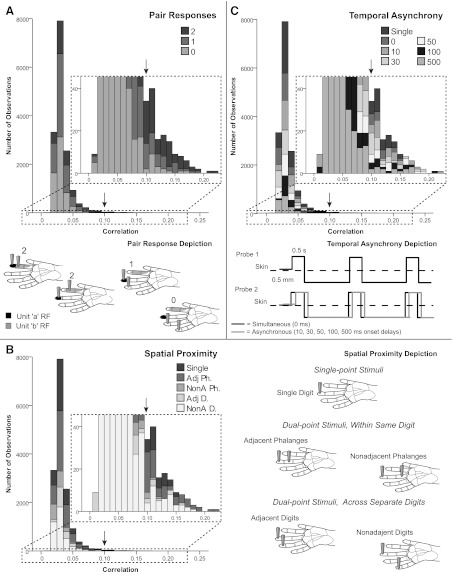
Frequency-distribution histograms for spatiotemporal stimulus relationships. Stacked frequency-distribution histograms show that the majority of observations for all categories had correlation magnitudes between 0.03 and 0.04. Insets marked by dotted lines show close-up of the low frequencies of occurrence. Arrows point to correlation value 0.10 on full-size and inset charts to aid orientation. A, top: for the pair response category, all response categories (0–2) occurred throughout the distribution, even at the high-magnitude correlation tail, but the highest magnitude correlations occurred when pair response = 2. Bottom, pair response schematic depicts possible configurations of stimulation probes in relation to neurons' receptive fields (RFs) for hypothetical units a and b, to categorize pair response relations. When pair response = 2, two types of relationships are possible: RFs of the units can be close in proximity and the stimulus probes can be close in proximity, and both units respond to stimulation; or one stimulus probe is within the RF of one unit while the second probe is in the RF of the second unit. B, left: for the frequency distribution of spatial proximity of stimulus probes, all spatial categories were distributed throughout, even at the high magnitude correlation tail. The highest magnitude correlations were observed when a dual-point stimulus was located on adjacent phalanges (Adj Ph). Adj Ph = 2 probes in the same finger on adjacent phalanges; NonA Ph = 2 probes within same finger on nonadjacent phalanges; Adj D = 2 probes on different, adjacent fingers; and NonA D = 2 probes on different fingers separated by 1 or more digits. Right, spatial proximity schematic illustrates categories for the spatial configuration of the stimulus probes. C, top: for the frequency distribution of temporal asynchrony of stimuli, the high-magnitude correlation tail included all temporal categories, with no clear trends relating to the highest magnitudes. Bottom, temporal asynchrony depiction of stimulation pattern. Solid lines indicate indentation on the skin. Paired stimulation, indicated by probes 1 and 2, may be simultaneous or asynchronous. Two probes are presented to different skin sites; however, the gray solid line (probe 2) shifted relative to the black line depicts overlap in contact time of probes 1 and 2.
