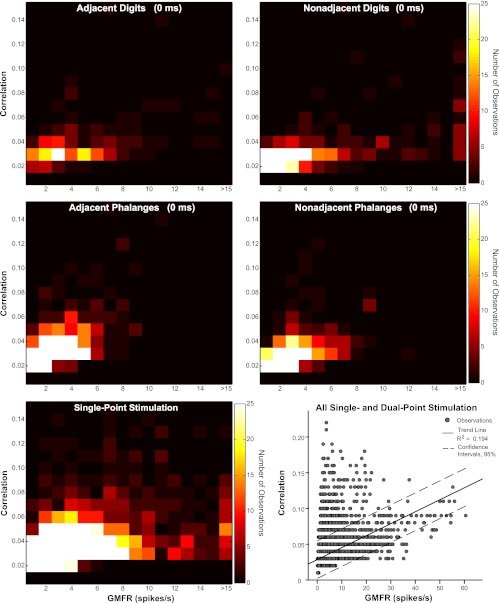
Fig. 5.

Relationship of correlation magnitudes with average firing rates. Peak correlation magnitudes vs. geometric mean firing rate (GMFR; spikes/s) of neurons in correlated pairs are shown in heat maps generated from scatter plots for single-point stimulation and simultaneous (0 ms) dual-point stimulation. Color scale applies to all maps and indicates frequency of neuron pair observations. Stimulus conditions shown are representative of the full set of results. Scatter plot shows data set (15,662 observations) with trend line (solid) indicating the weak relationship between correlation magnitude and GMFR overall (R2 = 0.194). Dotted lines represent 95% confidence intervals.
