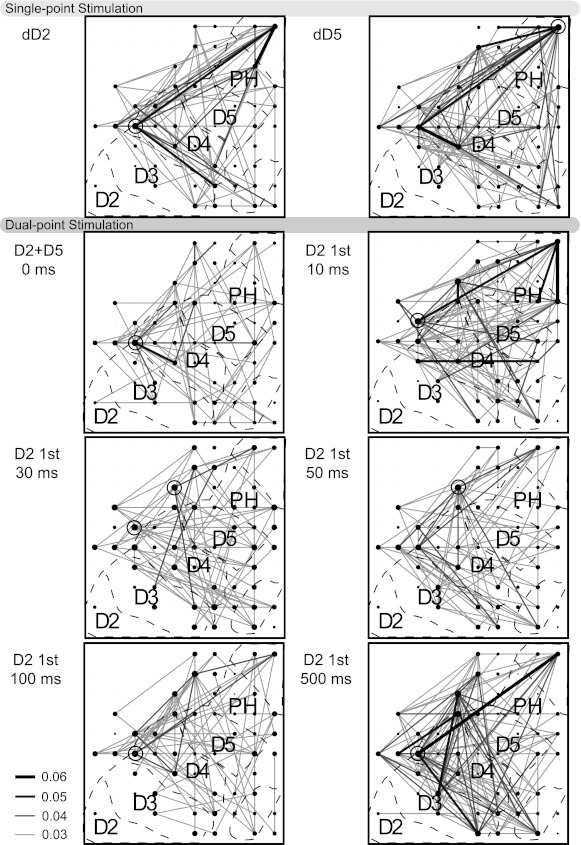
Fig. 6.

Depiction of correlations between neuron pairs during spatiotemporal stimulations. Stimuli were presented to distal digit 2 (dD2) and 5 (dD5) individually in blocks of 100 trials for monkey 3. These locations were stimulated simultaneously and asynchronously with dD2 stimulation preceding dD5. Black dots indicate electrode sites from which single neurons were recorded. Significant correlations represented by lines connecting the dots. Dot size indicates magnitude of the sum of all correlations with that neuron. Open circles surround dots that represent neurons with the highest magnitude of summed correlations. Shade and thickness of lines represent magnitude of correlations (see key). When correlations are not reliable, no lines are shown, but dot sizes increase to indicate which electrodes recorded single neurons during the stimulation (multi-unit activity = pinpoint dots). Overlay of approximate locations in area 3b is indicated by dashed lines. Networks of correlations were largely stable regardless of stimulus parameters, with a notable exception of reduced correlations when distant digits were stimulated simultaneously.
