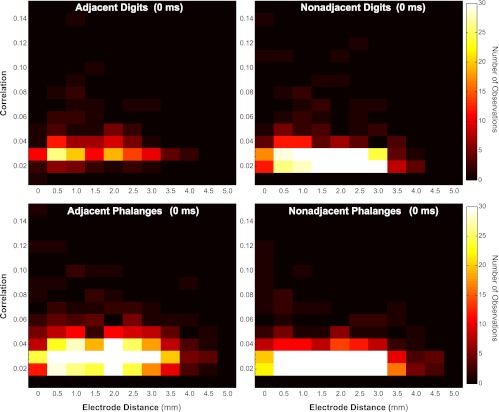
Fig. 7.

Relationship between correlation magnitude and distance between electrode pairs. Magnitudes of significant correlations plotted (y-axis) on the basis of geometric distance between electrode pairs from which the activity was recorded (x-axis) for each of the dual-point (0 ms) spatial proximity categories are shown in heat maps. Color scale applies to all plots and indicates number of neuron pairs observed. Generally, stronger correlations were found between neurons located on nearby electrodes, but correlations were found between neuron pairs separated by more than 4 mm, especially when 2 sites within 1 digit were stimulated.
