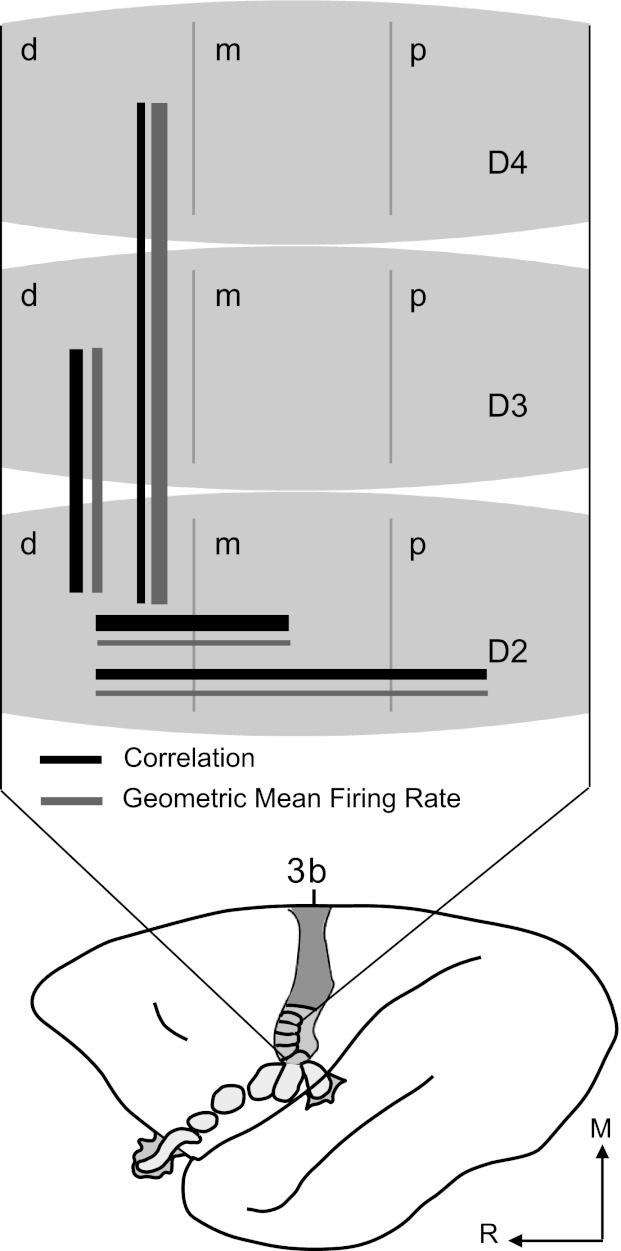
Fig. 8.

Summary of interactions within hand representation based on correlations and average firing rates. Schematic of owl monkey brain shows area 3b organization. Part of the hand representation is schematized and enlarged to summarize correlation and firing rate results. Digits are divided into distal (d), middle (m), and proximal (p) sections to represent phalanges within each digit. Solid black lines represent relationships between parts of the area 3b hand representation based on the magnitudes of correlations and proportions of correlated neuron pairs. Solid gray lines indicate relationships based on magnitudes of GMFR of correlated pairs. Line thickness approximates relative magnitudes within each category for spatial proximity of paired, dual-point stimuli. Relative strength of correlations between neurons did not strictly follow average firing rates of those neurons when different parts of the hand were stimulated.
