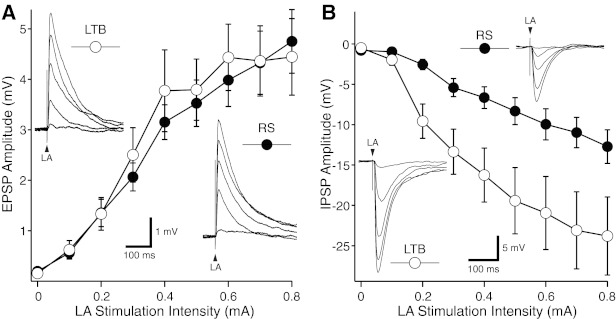
Fig. 4.

LA-evoked responses in LTB and RS CeL neurons. A: average ± SE excitatory postsynaptic potential (EPSP) amplitude (y-axis) as a function of LA stimulation intensity (x-axis) in samples of 27 RS and 16 LTB neurons. In all cases, prestimulus Vm was set to −80 mV. Insets: representative examples of responses seen in LTB (top left) and RS (bottom right) neurons with LA stimulus intensities ranging between 0.2 and 0.8 mA (each response is the average of ≥3 trials). B: average ± SE inhibitory postsynaptic potential (IPSP) amplitude (y-axis) as a function of LA stimulation intensity (x-axis) in samples of 12 RS and 10 LTB neurons. In all cases, prestimulus Vm was set to 0 mV. Insets: representative examples of responses seen in LTB (bottom left) and RS (top right) neurons with LA stimulus intensities ranging between 0.2 and 0.8 mA (each response is the average of ≥3 trials). In all tested cells, LA shocks were 0.1 ms in duration.
