
Figure 2. Distribution of the most likely bifurcating tree.
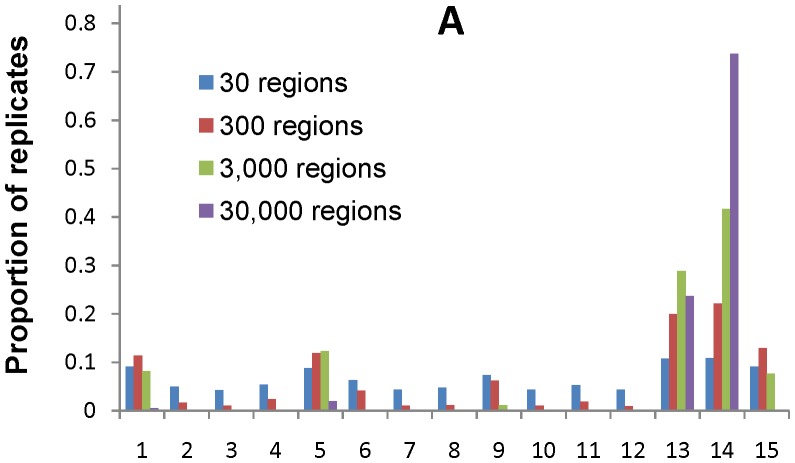
(A) Distributions based on 105 bootstrap replicates for 30, 300, 3,000 and 30,000 autosomal regions. (B) Key describing the bifurcating tree for the x-axis of Figure 2A.
Official websites use .gov
A
.gov website belongs to an official
government organization in the United States.
Secure .gov websites use HTTPS
A lock (
) or https:// means you've safely
connected to the .gov website. Share sensitive
information only on official, secure websites.
(A) Distributions based on 105 bootstrap replicates for 30, 300, 3,000 and 30,000 autosomal regions. (B) Key describing the bifurcating tree for the x-axis of Figure 2A.