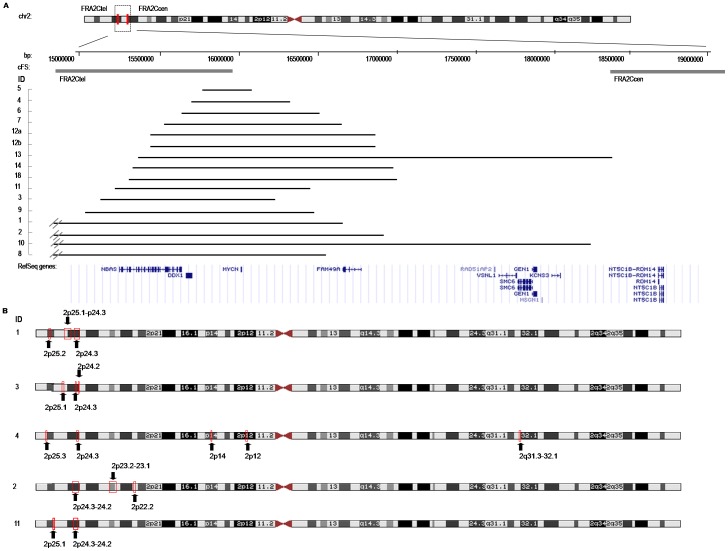
Figure 2. Schematic representation of the amplicons in chromosome 2.

All data are illustrated according to the NCBI build Hg19. (A) Genes included in the MYCN amplicon. The crossed lines in cases 1, 7, 9 and 10 indicate that the breakpoint mapped more distal in chromosome 2 than the area represented. (B) Boxes and arrows indicate position of the different amplicons in the cases with complex amplification. The cases have been listed according to chromosome 2 aberrations.
