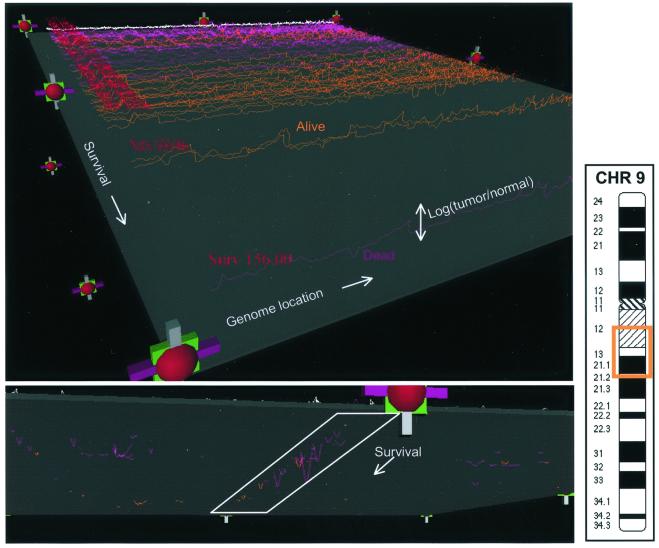
Figure 2.
VMRL display of 52 CGH profiles and 8 normal profiles. Each CGH profile is displayed along the x axis, with the y axis being log (relative copy number), z being overall patient survival, and the color of the lines encoding patient status (purple is deceased, orange is alive, and white indicates a normal control). The top view shows all profiles, with the lowest survival furthest from the viewer. The bottom view shows the data thresholded by using the gray plane, to eliminate the variation caused by noise, and highlights a region on chromosome 9 that appears to be linked with poor survival.

