
Figure 3. Evaluating MHC class I processing and presentation in SUM149 and rSUM149 cells. A.
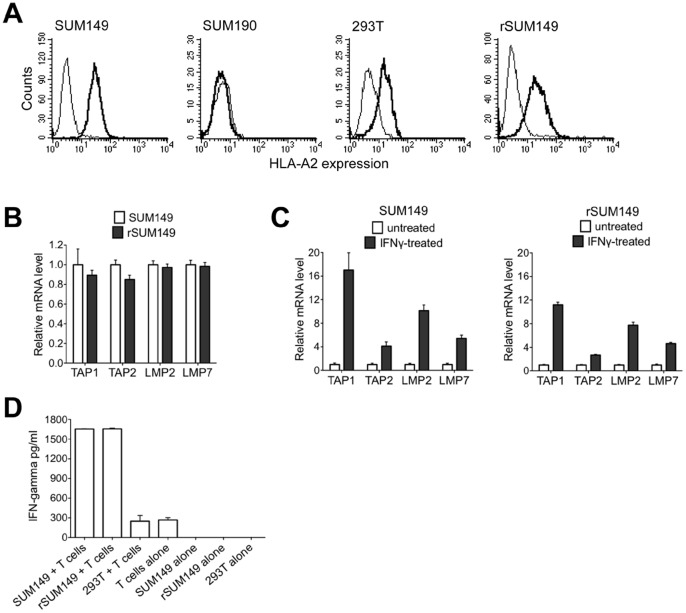
Cells used as targets in the CTL assay described in Figure 2 were analyzed for the cell surface expression of HLA-A2 class I molecule as indicated in the panel. The bold black histogram in each panel represents staining with the HLA-A2 specific antibody (clone BB7-2) versus the isotype control. B. Basal expression in the SUM149 and rSUM149 cells. The data shown is representative of replicated experiments analyzed using the ΔΔC(t) method and represented as relative expression (2−ΔΔC(t)). GAPDH was used as the normalization control. C. Expression after treatment with IFN-γ. The data shown is the average of replicated experiments analyzed using the ΔΔC(t) method and represented as relative expression (2−ΔΔC(t)). GAPDH was used as the normalization control with the untreated sample set to 1 and compared to the IFN-γ treated group. D. FOXP3-specific T cells were generated as described in Methods and Figure 2 above. T cells were allowed to rest overnight in RPMI medium with 10% FCS in the absence of cytokines. The following day, T cells were harvested and cocultured with target cells (SUM149, rSUM149 and 293T cells) at a 1∶1 ratio. T cells and target cells were maintained at 106 cells/ml and a 100 µl of each cell suspension was added to a 96-well V-bottom tissue culture plate in triplicates and incubated at 37°C for 16 hours. Supernatant was harvested and IFN-γ secretion was measured using a human IFN-γ ELISA kit from eBioscience. Controls used are indicated in the figure.