
Figure 4. FOXP3 expression in breast cancer cells. A.
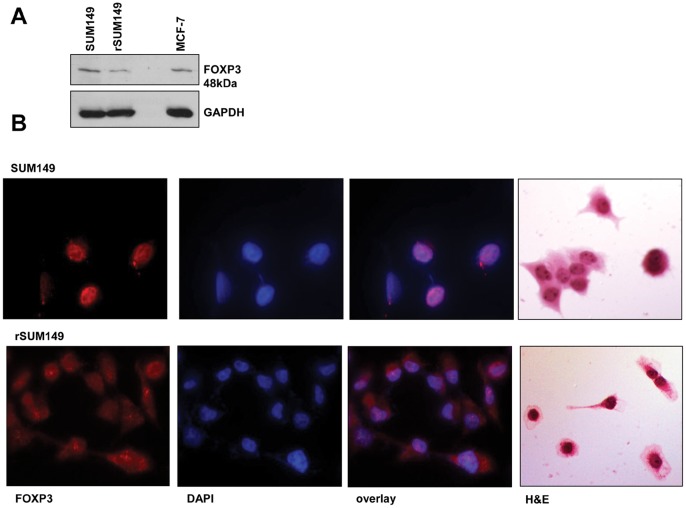
Immunoblot analysis of FOXP3 and GAPDH is shown as loading control. B. Representative fluorescent microscopy images of cells stained with antibodies to FOXP3 and probed with Alexa Fluor® 568 goat anti-rat IgG. Each slide was counterstained with DAPI and the overlay for each is shown. Hematoxylin and eosin (H&E) staining is shown for morphology of each cell line.