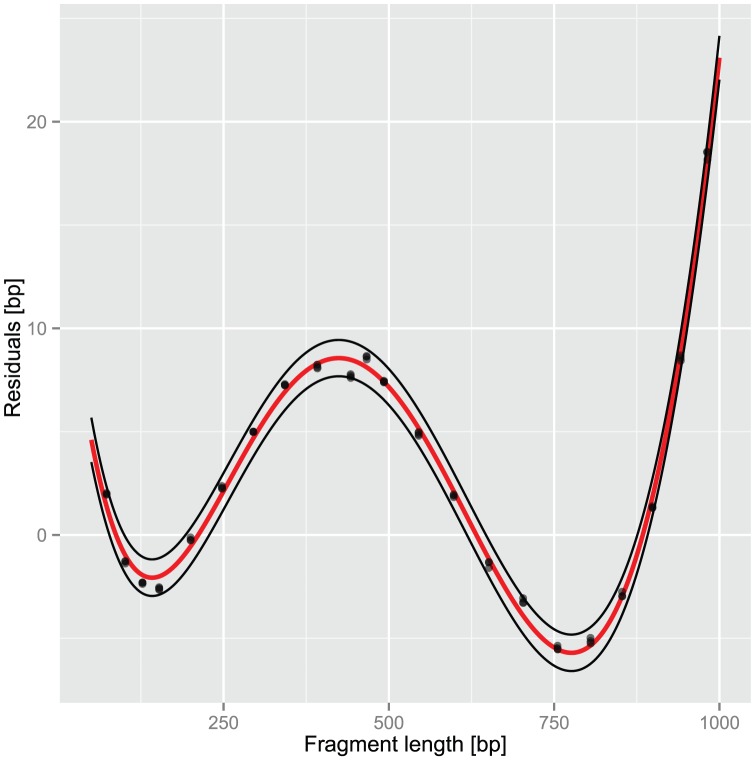
Figure 1. Residuals, the difference between real and estimated size, of a FAM-labeled size standard used as ‘sample’ in t-RFLP analysis.

Data from three replicate runs are shown. Fit: fifth order polynomial, red line; 95% prediction intervals: black lines.
