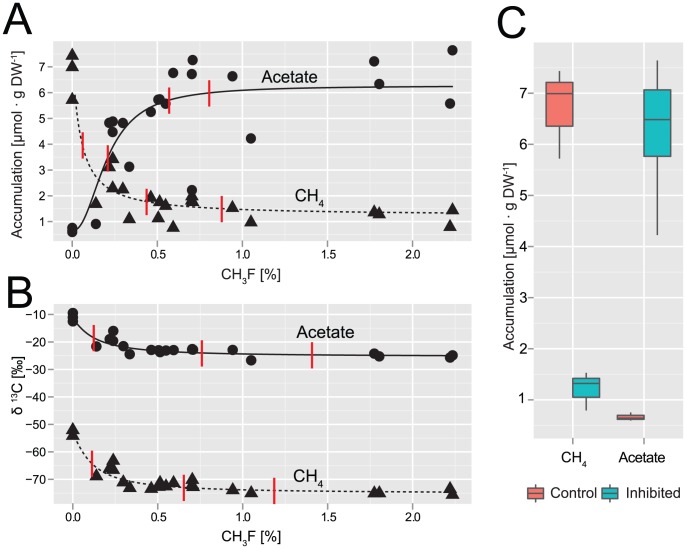
Figure 2. Accumulation of acetate and methane (A), and the respective δ13C signatures in ‰ VPDB (B) depending on initial concentrations of methyl fluoride; δ13Cacetate is the combined signature for both C-atoms.

Data are endpoint measurements and not corrected for initial concentrations. The fitted dose-response curves follow a log-logistic model with the parameters ED50 (effective dose for 50% inhibition), upper limit, and slope, while the lower limit was fixed to the respective averages for 0% CH3F. ED50, ED90, and ED95 are marked by red lines. (C) Box-plot summarizing accumulation of methane and acetate in control (n = 3) and in samples with CH3F≥0.75%, n = 6) after 14 days of anoxic incubation.
