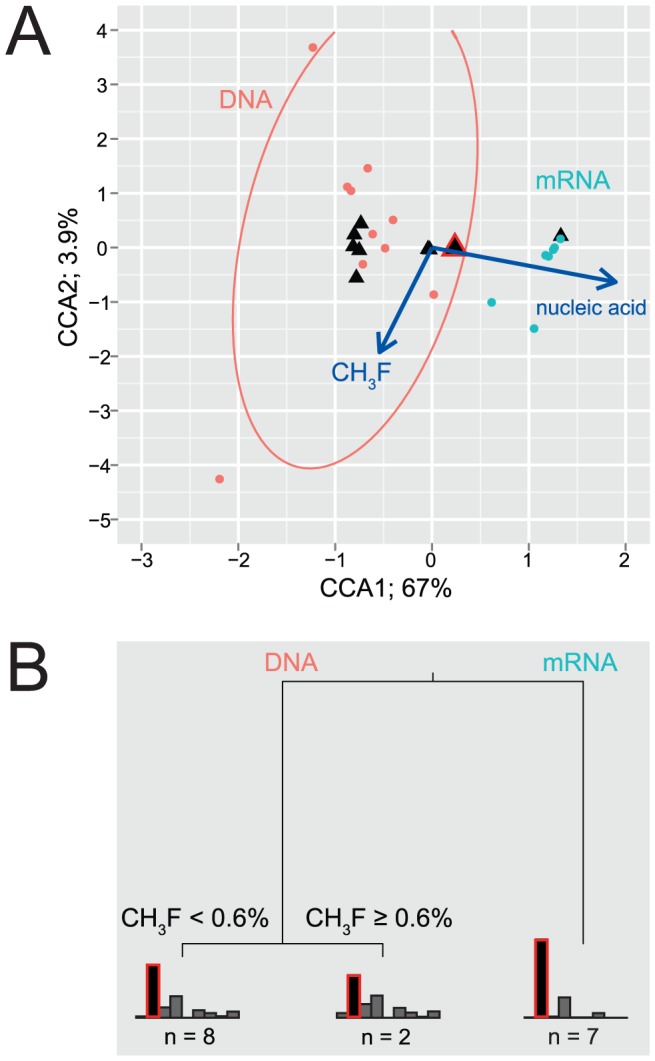
Figure 3. Multivariate analysis of relative abundances of terminal restriction fragments (tRF).

(A) Biplot of a constrained correspondence analysis (CCA). Two constraints were applied: CH3F concentration and the type of nucleic acid, i.e. DNA or mRNA. The CCA explains about 71% of overall variation, with CCA1 being the most important axis. The arrows indicate the direction in which constraints correlate with the ordination axes. Confidence ellipses (95%) surround the centers of DNA- and mRNA-derived communities, respectively. Closed circles represent the samples, and black triangles the different tRFs. The triangle surrounded by a red outline corresponds to tRF 133, the numerically dominant fragment. (B) Multivariate regression tree (MRT) based on squared Euclidean distances. The vertical spacing of the branches is proportional to the error in the fit; the first split reduces the error by 75%. The tree is pruned, i.e. the least important splits have been removed. Barplots at the leaves show the relative abundance of different tRFs; from left: 126, 133, 503, 648, 652, 663, 683, 743, and 752 bp. As in panel A, tRF 133 is marked by a red outline.
