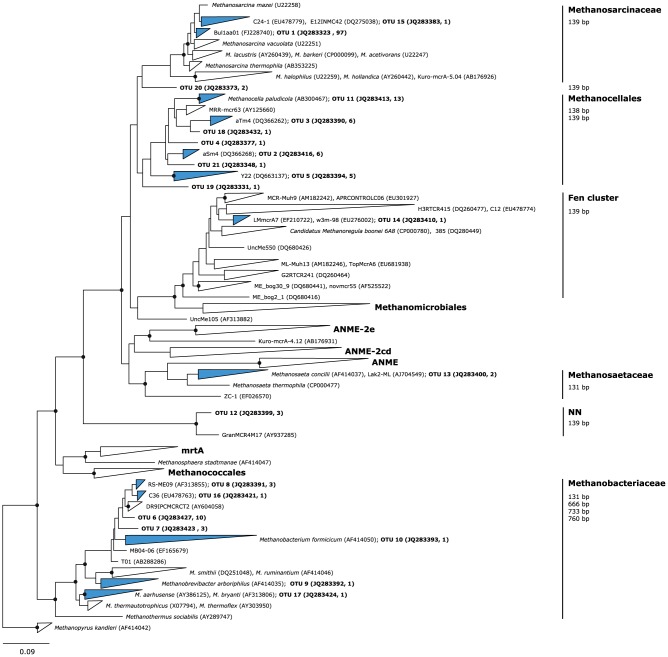
Figure 4. Neighbor-joining tree based on 147 deduced amino acid positions from 949 mcrA sequences.

Phylogenetic nodes verified by a maximum likelihood tree are marked with closed circles. The outer branches of distinct clusters are collapsed, and those containing OTUs defined in this study are marked in blue. Only representative sequences for the OTUs have been incorporated into the tree and are depicted as ‘OTU name (accession number, number of sequences representing the OTU)’. Environmental clusters were labeled with two reference sequences showing maximum phylogenetic distance within the respective cluster, given as ‘name 1 (accession number 1), name 2 (accession number 2). The corresponding tRFs were calculated in silico using the TRiFLe package [64] and are given to the right. Scale bar: 0.09 changes per amino acid position. The outgroup is Methanopyrus kandleri.
