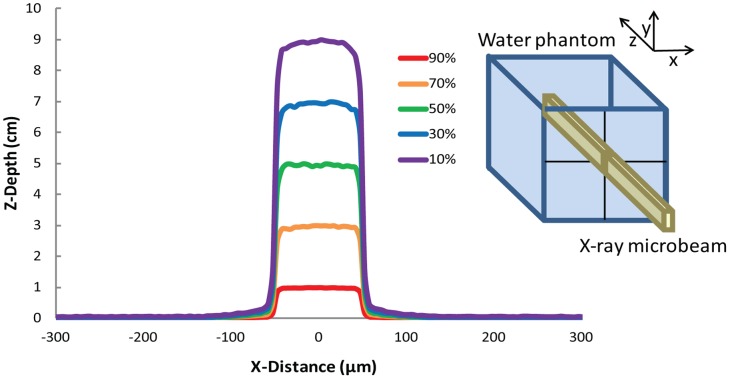
Figure 1. Isodose curves deposited by a microbeam.

Dose profiles deposited in a 16×16×16 cm3 water phantom by a single 100 µm wide and 10 mm high X-ray microbeam of 100 keV (Monte Carlo simulations), i.e. of energy similar to the median energy of the used spectrum (inset), propagating along the z direction The 50% of the dose is deposited at about 5 cm depth. Objects are not to scale.
