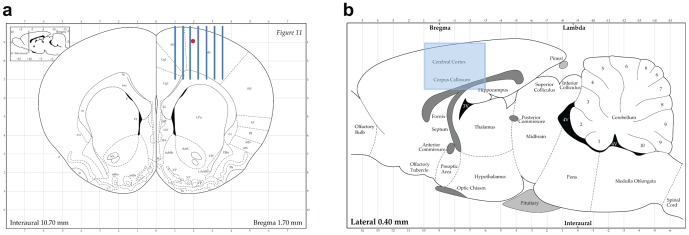
Figure 2. Schematic representation of microbeam irradiation geometry.

Coronal (a) and sagittal (b) section of the Paxinos and Watson's rat brain atlas. Arrays of 100 or 600 µm thick microbeams (here represented the 100 µm case, minimum center-to-center spacing: 400 µm) were delivered perpendicular to the sensorimotor cortex using an atlas-based image guided X-ray setup. In (a) is indicated the point where the kainic acid injection was performed to create status epilepticus in rats. Copyright 1998 with permission from Elsevier.
