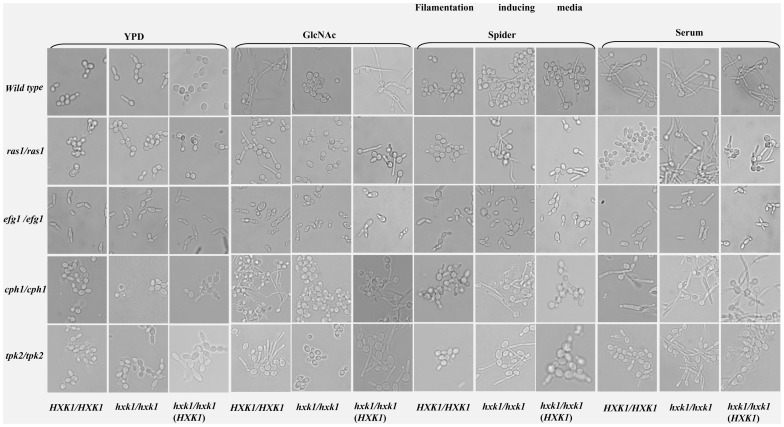
Figure 3. Morphological and expression pattern analyses among wild type, hxk1 and different filamentation pathway mutants.

A) Morphology of wild type, filamentation pathway mutants under different hypha-inducing conditions. The starved cells of wild type (HXK1/HXK1 ) and hxk1 mutant(hxk1/hxk1), ras1/ras1, ras1/ras1 hxk1/hxk1, efg1/efg1, efg1/efg1 hxk1/hxk1, cph1/cph1, cph1/cph1 hxk1/hxk1, tpk2/tpk2, tpk2/tpk2 hxk1/hxk1l and their respective complemented strains in which one functional copy of HXK1 is reintroduced in the native locus were resuspended in non-inducing and various induction media such as 2.5 mM GlcNAc in salt base, Spider pH 7.2 and Serum (20%). Cells were induced at 37°C for 4 hours in case of GlcNAc, for 2 hours at 37°C in case of Spider and Serum and in case of YPD for 2 hours at 30°C. hxk1 mutants except efg1/efg1 hxk1/hxk1 were hyperfilamentous in filamentation inducing conditions like Spider and Serum. In response to GlcNAc, all hxk1 mutants failed to form germ tubes due to its inability to catabolize the sugar, but the complemented strains were hyper filamentous. B) Expression of hyphal specific genes in different filamentation inducing media in filamentation pathway mutants. Northern blot analysis to show the expression of Hyphal Specific Genes (HSGs) like HWP1, ECE1 or RBT4 for the cells grown in various filamentation inducing media. Total RNA was isolated from wild type, CAF2–1 (HXK1+/HXK1 ) and hxk1 mutant (hxk1/hxk1), ras1/ras1, ras1/ras1 hxk1/hxk1, efg1/efg1, efg1/efg1 hxk1/hxk1, cph1/cph1, cph1/cph1 hxk1/hxk1, tpk2/tpk2, tpk2/tpk2 hxk1/hxk1 strains induced in YPD, GlcNAc, Spider and 20% Serum. 20 µg of RNA was loaded in each lane and a Northern blotting was performed. As an internal control methylene blue staining of rRNA was used to ensure equal loading of RNA. hxk1 mutants except efg1/efg1 hxk1/hxk1 showed upregulation of HSGs in filamentation inducing conditions and upregulation was more prominent in Spider medium. C) Quantification of HXK1 mediated filamentation : q-RT PCR analysis of HSGs (ECE1, HWP1and RBT4) in hxk1 single and double mutants (ras1 hxk1, efg1hxk1, cph1hxk1 and tpk2 hxk1) in Spider grown cells compared to their wild type and respective single mutants (ras1, efg1, cph1 and tpk2). Comparative expression levels of HSGs for cells grown in YPD have also been shown. ACT1 has been selected as the endogenous control. The error bars represent co-efficient of variation.
