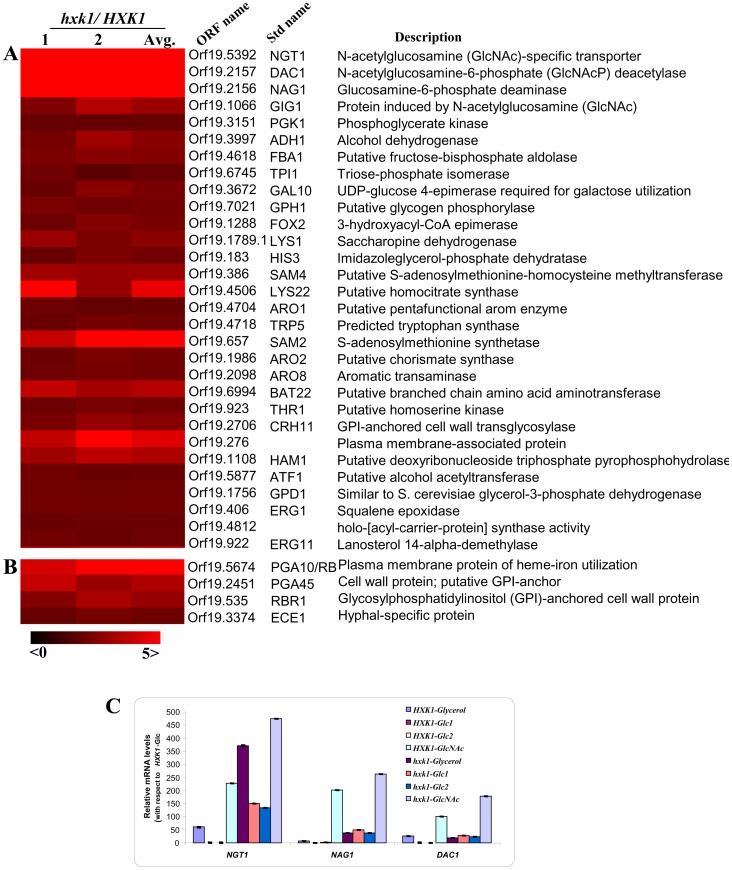
Figure 8. Transcriptome analysis of HXK1 regulated genes.

A) Partial Heat map of over-represented genes (p-values <0.05, False Discovery Rate <1% in GO term analysis) differentially expressed in a HXK1 dependent manner in response to glucose. Two-color microarray data expressed as hxk1/HXK1 ratio (1 and 2 are biological replicates with dye swap, average of 1 and 2, Ave) is plotted as heat map. The color scale at the bottom indicates the log2 ratio. B) Heat map of Hyphal specific genes (HSGs) differentially expressed in a HXK1 dependent manner in response to glucose. C) Modulation of expression levels of GlcNAc catabolic genes by HXK1. Quantitative RT-PCR of GlcNAc catabolic gene transcripts NGT1, NAG1 and DAC1 in C. albicans wild type (CAF2–1) and hxk1 mutant, cells in response to glycerol-6%, Glucose-2%, Glucose-5 mM or GlcNAc-5 mM. ACT1 has been selected as the endogenous control. The error bars represent co-efficient of variation.
