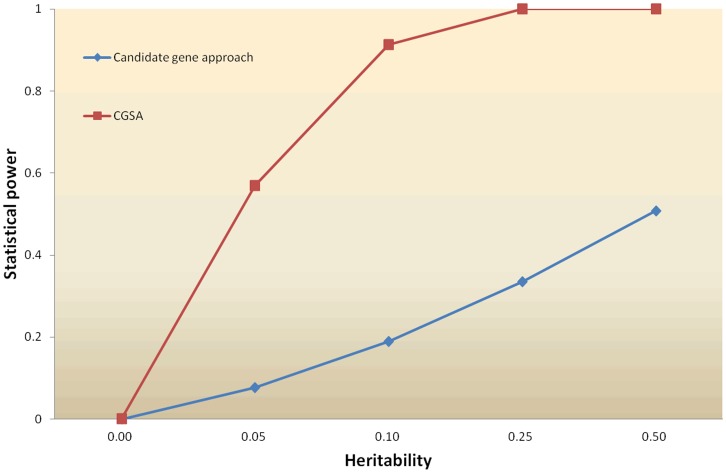
Figure 1. Statistical powers between CGSA and candidate gene approach under different heritability levels.

The power was examined on a trait simulated from 15 causative mutations (QTNs). A total of 1000 replications were conducted for each method. The heritability of the trait varied from 0 to 0.5. The differences between our CGSA and candidate gene set approach with mid-level and low-level of heritability were greater than the one with high heritability.
