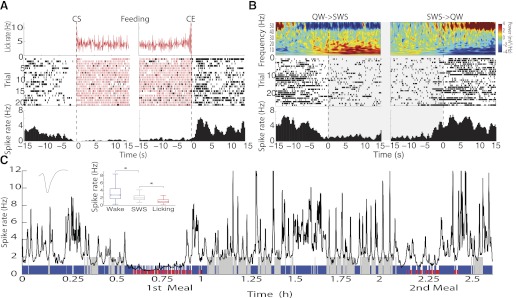
Fig. 4.

Responses of a pMSN whose activity was inhibited both by feeding and during SWS (inactive/SWS-off). A: top trace (red) shows that during CS and throughout the cluster to the CE, the licking rate (licks/s) remained approximately constant. Middle panel (trial) shows the raster plot, and bottom trace displays the PSTH showing that the activity decreased before CS and remained essentially depressed throughout the cluster. On the cession of licking, the activity once again increased. B: the same neuron as in A but during the quiet wake-SWS-quiet wake (QW→SWS→QW) transition. Top trace shows the spectrogram recorded during a “sleeping bout” when the animal went from QW to SWS and from SWS to QW states. The spectrogram shows that during the QW state, much of the power increased in the high gamma frequency centered at 50 Hz, which gradually decreased as the animal entered into the SWS state, where the power increased but in the low-frequency range (0.7–20 Hz). The raster and PSTH show that during SWS, the spike rate decreased and became active upon the animal waking. C: spike rate of the same neuron, shown during the 2.6 h when the animal ate 2 meals (red), was active (blue), and slept (gray). The activity was filtered at a 10-s Gaussian window and a 1-s steep moving window. Inset: median ± SE of the spike rate for each second throughout the 3 states. *P < 0.05. This neuronal response is the same as that plotted in Figs. 2 and 3A.
