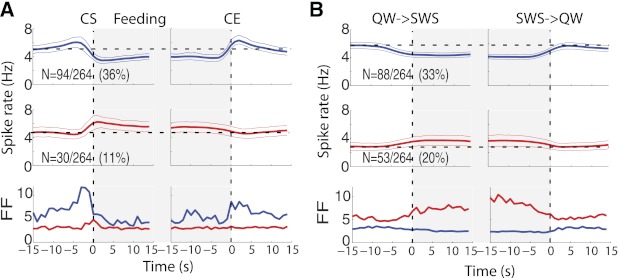
Fig. 6.

Spiking heterogeneity and population activity around feeding (A) and SWS (B). A, top: the population PSTH activity of all inactive neurons (blue, neurons 1–94 in Fig. 5 and Table 2) with responses aligned to time = 0 s for CS (left) and CE (right). Middle panels show the population activity of active neurons (neurons 95–124 in Fig. 5 and Table 2) around licking for Ensure. Bottom panels show the spiking heterogeneity measured by the Fano factor (FF) for inactive (blue) and active neurons (red). Note that during licking, the spiking patterns across inactive neurons showed greater variability preceding CS and at CE, whereas in contrast, both active responses show little spiking variability. B: the same as in A, but responses were aligned to the QW→SWS to SWS→QW transitions. Top panel (blue) plots all 88 neurons that showed a significant inhibition during SWS (SWS-off only, inactive/SWS-off, and active/SWS-off; see Table 2). Middle panel (red) plots all 53 neurons that were excited during onset SWS (SWS-on only, inactive/SWS-on, and active/SWS-on; see Table 2). Bottom panel plots the FF for each population. Note that in general, SWS-off neurons showed little if any spiking variability during SWS, suggesting that most neurons in this population basically follow the same temporal spiking patterns during SWS sleep. In contrast, SWS-on neurons had greater spike count variability during SWS.
