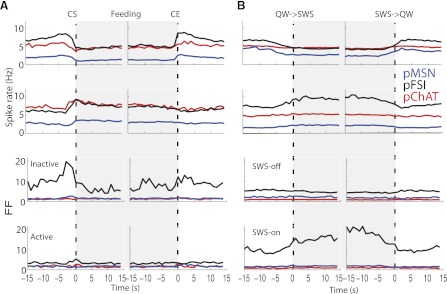
Fig. 8.

Population activity and spike count variability around feeding (A) and sleep (B) as a function of cell type. Conventions are the same as described in Fig. 6. Shown are population PSTHs plotted in Fig. 6 but now sorted as a function of cell type (indicated by color). A: top 2 rows show population activity of inactive (first row) and active neurons (second row) with responses aligned to time = 0 s for CS and CE. Bottom 2 rows display the FF for inactive (third row) and active neurons (fourth row). Note that pFSIs (black lines) had the largest population spike count variability preceding CS and at CE. B: the same as in A, but responses were aligned to the QW→SWS and SWS→QW transitions. In general, SWS-off neurons (third row) show little if any modulation of FF during SWS, suggesting that different cell types in this population basically follow the same spike count pattern during SWS sleep. In contrast, for SWS-on neurons (fourth row), mainly the pFSI subpopulation had a greater FF during SWS, suggesting that SWS-on/pFSI neurons have a heterogeneous population firing during this brain state.
