
Fig. 2.
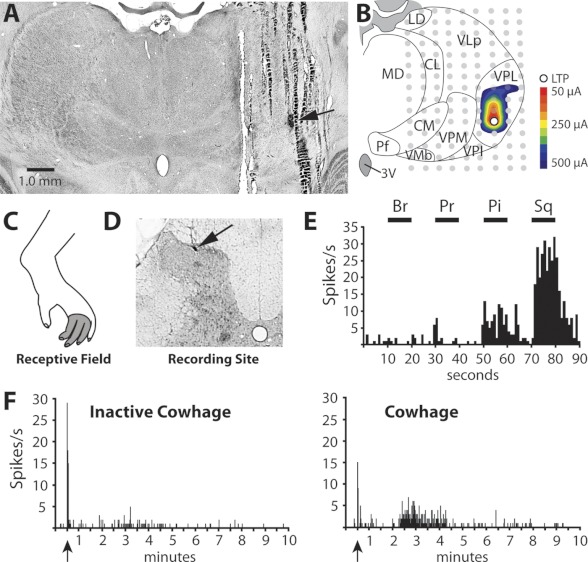
Characterization of a cowhage-responsive STT neuron with an axon projection to VPL. A: section of thalamus containing the lesion marking the LTP (arrow). B: illustration of the same section showing antidromic thresholds in a color contour plot. C: receptive field. D: lesion marking the recording site in the SDH (arrow). E: mechanical sensitivity; the cell was classified as high threshold (HT). Sq, squeeze. F: application of inactivated cowhage produced little or no activation, but active cowhage evoked 2 min of activity after a latency period.