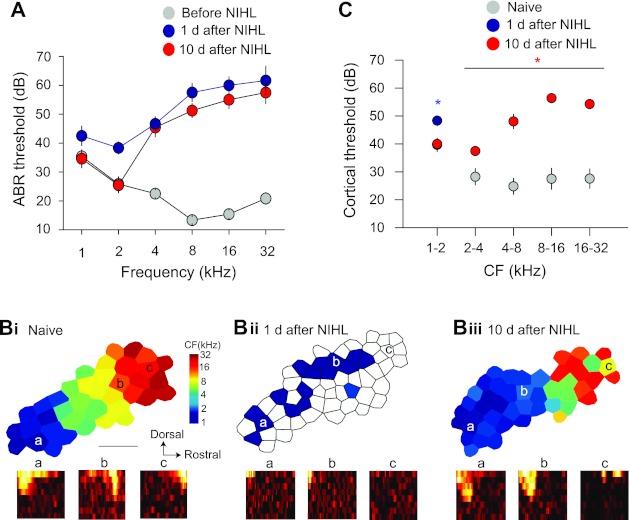
Fig. 1.

Map reorganization caused by transient and long-term hearing loss. A: noise exposure-induced transient and long-term threshold shift of the auditory brain stem responses (ABRs). ABRs were recorded in the same animals before and after noise-induced hearing loss (NIHL). B: cortical maps before (i) and 1 day (ii) and 10 days (iii) after NIHL. Bottom: receptive fields (RFs). The locations of the RFs are marked in the maps. Horizontal axis of the RF depicts frequencies from 1 to 32 kHz; vertical axis depicts intensity from 0 to 70 dB SPL. CF, characteristic frequency. C: response threshold of auditory cortical neurons. One day after NIHL, only lower-frequency responses were observed. Ten days after NIHL, neurons showed lower response threshold at lower frequencies. *P < 0.05.
