Fig. 2.

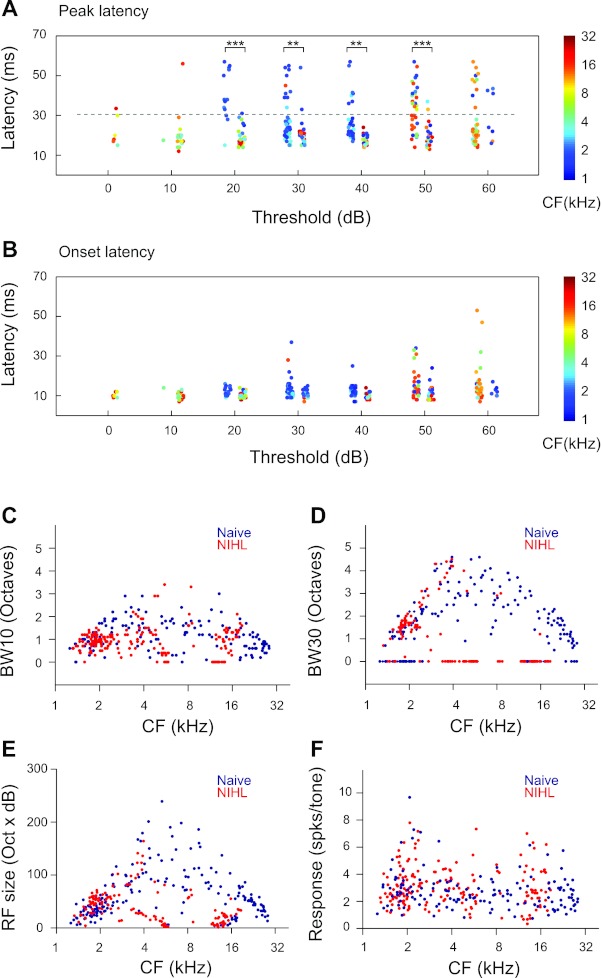
NIHL alters cortical neuron response properties. A: peak latencies of neurons in NIHL animals (left columns) and naive animals (right columns) as functions of the threshold of the neurons. Random jitters were added to the thresholds to facilitate visualization. Colors of the dots code for the neuronal CFs. B: onset latencies of the same neurons as in A. C: bandwidth at 10 dB above threshold (BW10) as functions of neuronal CFs. BW10 was not measured for neurons with a threshold higher than 20 dB. Those neurons were assigned a BW10 value of 0. D: bandwidth at 30 dB above threshold (BW30). BW30 was not measured for neurons with a threshold higher than 40 dB. Those neurons were assigned a BW10 value of 0. E: RF sizes as functions of neuronal CFs. The RF size was calculated as the number of frequency-intensity combinations in the range of 1–30 kHz at 0.1-octave steps and 0–70 dB at 10-dB steps. F: mean response magnitude, which is measured as the mean responses per tone for all the tones in the response area of the neuron. Unpaired t-tests: **P < 0.005, ***P < 0.0001.
