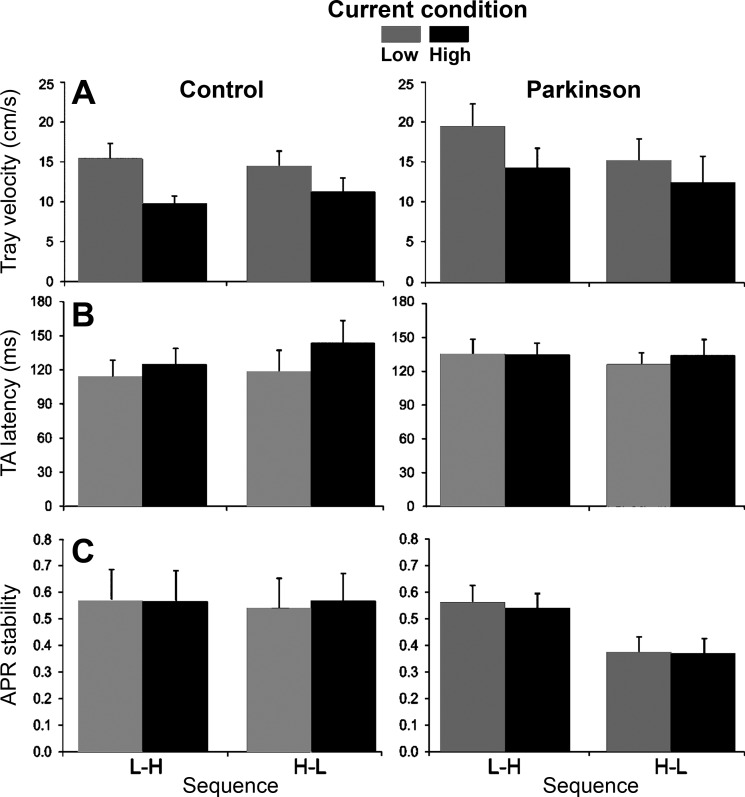
Fig. 3.

Postural and voluntary performance. A–C: averages and SEs across subjects for tray velocity (A), tibialis anterior (TA) latency (B), and margin of automatic postural response (APR) stability (C) for current constraint and constraint sequence for PD and control groups (high values are interpreted as increased postural stability).
