
Fig. 2.
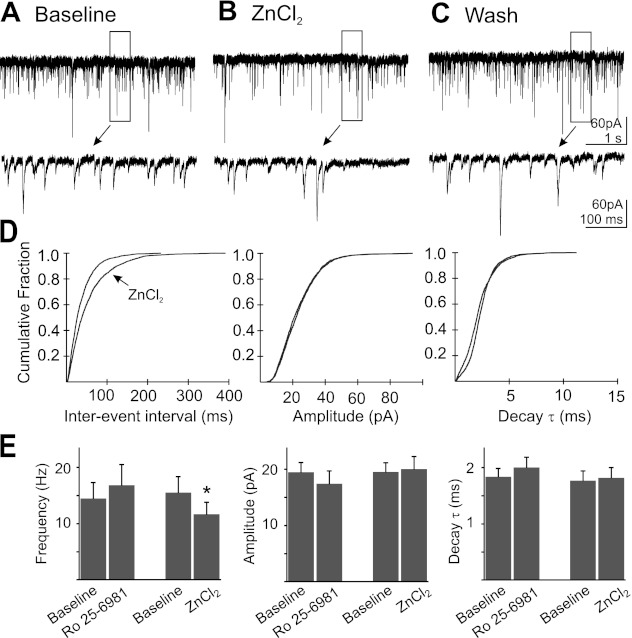
Application of Ro 25–6981 (n = 11) did not change frequency, amplitude, or decay τ of mEPSC, while ZnCl2 (n = 8) application decreased mEPSC frequency without changing amplitude or decay τ. A: representative recording of mEPSCs in a DMV neuron. B: recording of mEPSCs from the same neuron during the application of ZnCl2 (5 μM; 15-min application). C: recording from the same neuron during wash to control ACSF. Boxed areas in A–C are shown expanded temporally below each trace. D: cumulative probability plots of mEPSC frequency, amplitude, and decay τ for the neuron represented in A–C. E: mean mEPSC frequency, amplitude, and decay τ before and during the application of ZnCl2 (n = 8) or Ro 25–6981 (1 μM) (*significant difference from control; P < 0.05).