
Fig. 11.
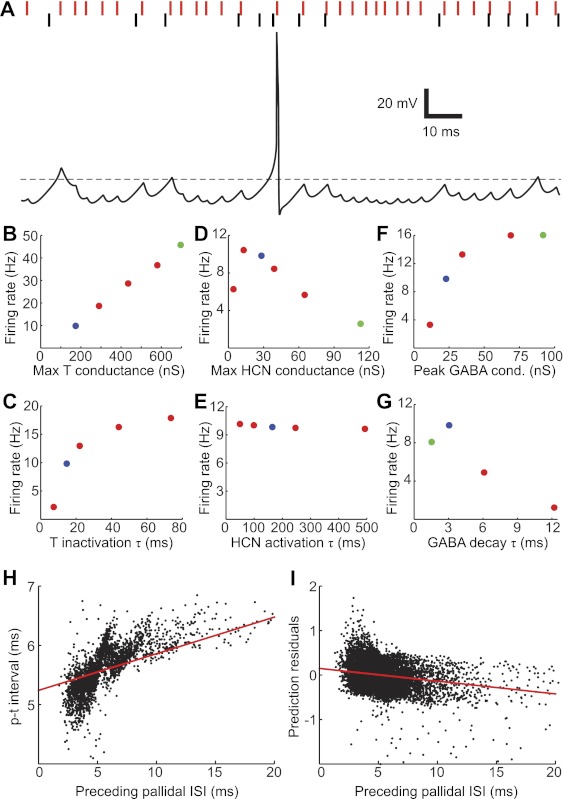
Postinhibitory rebound firing in the model: response to a recorded pallidal spike train. A: response of the model (at 41°C) to a pallidal spike train recorded in a singing bird (pair 4). The trace shows a brief segment of the membrane potential trajectory during stimulation; the dashed line is −60 mV. The vertical red and black lines show the pallidal and thalamic spike times, respectively, recorded in this pair during this time segment. B–G: red circles, effect of selected model parameters on average firing rate, including maximal T conductance (B), T inactivation time constant (τ) (C), maximal HCN conductance (D), HCN activation time constant (E), peak GABA conductance (F), and GABA decay time constant (G). The T inactivation and HCN activation time constants are voltage dependent; the plots show their values at −70 mV. Blue circles, parameter values of baseline model. Green circles, parameter values for modified model shown in H and I (baseline values were used for the T inactivation and HCN activation time constants). H and I: examples of history dependence exhibited by the modified model. Both the p-t interval (H) and the residuals of the prediction given by Eq. 1 (I) varied with the duration of the preceding pallidal ISI. Red lines show linear fit to the data.