
Fig. 3.
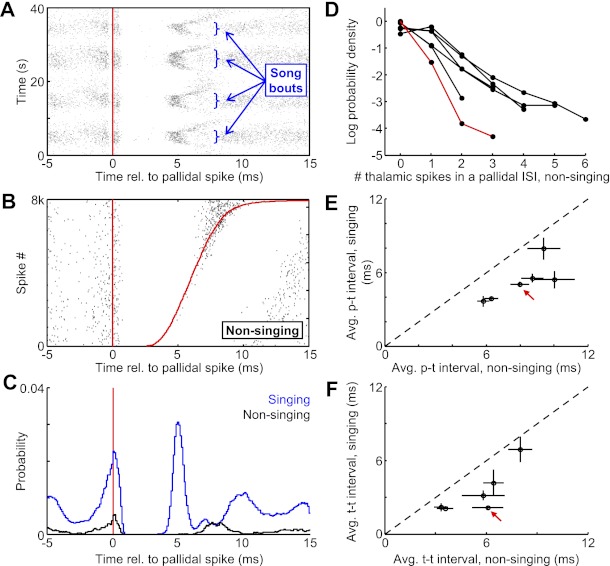
Dynamics of pallidothalamic transmission depend on the behavioral state of the bird. A: raster plot of thalamic spikes (black ticks) aligned to the timing of pallidal spikes (red line) for the pair shown in Fig. 2 (pair 1). Data are from 40 consecutive seconds of recording, containing 4 bouts of singing. Note that the duration of thalamic spike suppression is shorter during song bouts. B: raster plot, as in Fig. 2C. Red line at right shows the time of the next pallidal spike. The plot is sorted by the duration of the pallidal ISI (n = 8,000 ISIs during nonsinging). C: histograms of thalamic spike probability aligned to the timing of pallidal spikes during singing (blue) and nonsinging (black). D: log-probability of the number of thalamic spikes that discharge within single pallidal ISIs. Each trace is from a single pair during singing, and the red trace represents data from the pair at left and from Fig. 2. E and F: the average p-t interval (E) and t-t interval (F) computed during singing plotted against the value computed during nonsinging. Red arrows point to the points corresponding to the pair in A–C. Error bars are SD.