
Fig. 6.
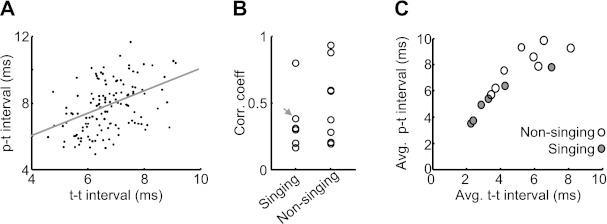
p-t and t-t intervals are correlated with one another. A: the p-t interval measured within each pallidal ISI plotted against the average t-t interval measured within the same ISI (plotted only for pallidal ISIs containing ≥2 spikes, pair 4). B: the coefficient of correlation between the average p-t and t-t intervals measured in the same pallidal ISI for all pairs recorded during singing (n = 6) and nonsinging (n = 8). Arrow points to the pair shown in A. C: the average p-t intervals are plotted against the average t-t intervals computed in the same pair. Data are from singing (shaded circles, n = 6 pairs) and nonsinging (open circles, n = 8 pairs) periods.